Use the Asset Monitor component on the Desktop to display results of monitoring configured in an Asset Scanning and Monitoring definition, including the state of devices and their CPU, memory, disk space, and services.
When you add the Asset Monitor ![]() component
to a Desktop tab, an Add Monitored Devices link will appear for you to
select the devices to appear in the component. Select the devices in the
Host column and then click the Add
Selected Devices link.
component
to a Desktop tab, an Add Monitored Devices link will appear for you to
select the devices to appear in the component. Select the devices in the
Host column and then click the Add
Selected Devices link.
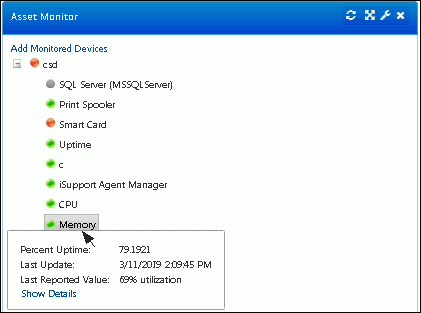
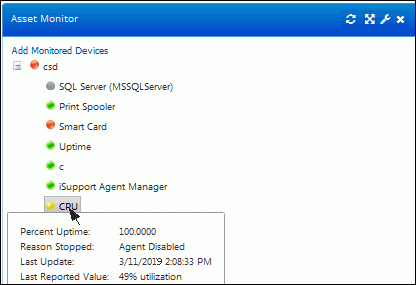
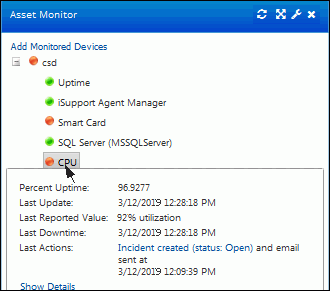
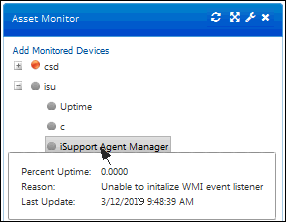
The state of monitored items and devices will be indicated by green, red, yellow, and gray dots; you can display details in a tooltip by hovering over the item or device name.


A red dot will appear if, after everything has been working correctly, a problem occurs with the item or device being monitored such as a service stoppage or a configured threshold that is not met (if any of the configured reporting thresholds are met (a monitored device is off-line or has high memory or CPU utilization, a monitored drive has disk space lower than the specified percentage, or a monitored service has a stopped state). Click the Show Details link in the tooltip to display a chart of the occurrences at which a configured threshold was exceeded and other details.

A gray dot will appear for a monitored item or device on which the WMI listeners cannot be started (for example, if an error occurred with permissions).
